
Open Journal of Clinical and
Medical Images
Research Article - Open Access, Volume 5
Cognitive trajectories of sedentary middle-aged and elderly adults in China: Based on group-based trajectory model
Siyuan Kong; Ran Yan*
School of Physical Education, Southwest University, Chongqing 400715, China.
*Corresponding Author: Ran Yan
School of Physical Education, Southwest University, Chongqing 400715, China.
Email: 1215520870@qq.com
Received : Nov 30, 2025
Accepted : Dec 16, 2025
Published : Dec 23, 2025
Archived : www.jclinmedimages.org
Copyright : © Yan R (2025)
Abstract
Purpose: This study aims to reveal the diverse developmental trajectories of cognitive function among sedentary middle-aged and older adults in China and to explore the potential factors influencing these trajectories.
Methods: Utilizing data from the China Health and Retirement Longitudinal Study (CHARLS) collected in 2011, 2013, 2015, and 2018, a longitudinal cohort was established. A total of 3,461 participants were assessed using the Mini-Mental State Examination (MMSE). Group-Based Trajectory Modeling (GBTM) was employed to identify distinct cognitive function trajectories within the sedentary population. Lasso regression was used to select potential predictors, and multivariable logistic regression analysis was performed to analyze factors associated with different cognitive function trajectories.
Results: The study identified three distinct cognitive function trajectories: “Low Cognitive Function Group,” “Moderate Cognitive Function Group,” and “High Cognitive Function Group.” Significant differences were observed in baseline characteristics among these trajectory subgroups. Notably, older age, rural residency, lower educational attainment, unmarried status, lack of daily leisure activities, and higher CES-D 10 scores among sedentary middle-aged and older women were identified as key populations for targeted interventions to address cognitive decline.
Conclusion: The developmental trajectories of cognitive function among sedentary middle-aged and older adults in China exhibit considerable heterogeneity. Tailored interventions designed for the specific characteristics of each subgroup are crucial for effectively preventing and treating depression.
Keywords: Sedentary behavior; Cognitive function trajectories; Longitudinal cohort study; Group-based trajectory model.
Citation: Kong S, Yan R. Cognitive trajectories of sedentary middle-aged and elderly adults in China: Based on group-based trajectory model. Open J Clin Med Images. 2025; 5(2): 1213.
Introduction
As the global population ages at an accelerating rate, the prevalence of cognitive impairment is increasing significantly. In 2018, an estimated 50 million people worldwide were affected by dementia, a figure projected to rise to 152 million by 2050 [50]. Dementia is a syndrome characterized by cognitive dysfunction as its core manifestation, often accompanied by diminished social skills and behavioral abnormalities [33]. In China, the prevalence of cognitive impairment is particularly notable, affecting approximately 15% of older adults [25]. With over 360,000 new cases of cognitive impairment annually, the total number of affected individuals is expected to reach 48.68 million by 2060 [32]. Dementia is a chronic, incurable condition, and cognitive impairment is often regarded as an intermediate state between normal aging and dementia [20]. Therefore, with the rapid growth of the elderly population, understanding the developmental trajectory of cognitive impairment and its potential influencing factors is essential for promoting effective interventions, managing this condition, and achieving healthy aging [47].
In recent years, sedentary behavior has emerged as a critical health-related behavior. Numerous epidemiological studies have demonstrated the significant adverse effects of sedentary behavior on various health outcomes(de Rezende et al., 2014). Sedentary behavior, distinct from physical inactivity, refers to activities involving a sitting, reclining, or lying posture with an energy expenditure of ≤1.5 Metabolic Equivalents (METs) during wakefulness [42]. Evidence suggests a significant association between sedentary behavior and the risk of cognitive impairment and dementia in middle-aged and older populations, with those engaging in sedentary behavior experiencing greater cognitive decline compared to their non-sedentary counterparts [10,46]. However, most studies on cognitive impairment have predominantly focused on older adults [17] or specific patient populations, such as individuals with cardiovascular disease or breast cancer [19,28], with limited attention to the impact of sedentary behavior on the general middle-aged and older population. Moreover, existing research indicates that cognitive trajectories vary significantly across different populations [47]. Early identification of potential risk factors for cognitive decline is therefore crucial for delaying or preventing the onset of cognitive impairment [45].
Notably, recent studies increasingly identify sedentary behavior as an independent risk factor for cognitive decline [18,36]. While previous studies have explored the relationship between sedentary behavior and cognitive impairment, many have relied on cross-sectional designs [6,10] or longitudinal studies [3], which have not fully accounted for the potential heterogeneity in individual cognitive trajectories. GBTM, a finite mixture modeling technique, offers the capability to simultaneously estimate multiple trajectories and identify subgroups with distinct developmental pathways, addressing the limitations of linear mixed models. GBTM captures the heterogeneity in individual trajectories, providing a more comprehensive understanding of the long-term patterns of cognitive impairment within populations [30].
Against this backdrop, this study focuses on sedentary middle-aged and older adults in China, employing the GBTM approach to uncover the diversity of cognitive trajectories and their potential influencing factors. By identifying subgroup characteristics associated with different cognitive trajectories, this study aims to facilitate the development of more precise, personalized interventions and treatment strategies, thereby providing a scientific foundation for the early identification and effective management of high-risk populations. Ultimately, this study seeks to enhance awareness of cognitive health among sedentary middle-aged and older adults and provide actionable recommendations for prevention and intervention strategies.
Methods
Data source
This study is based on data from CHARLS conducted in 2011, 2013, 2015, and 2018. CHARLS is a nationally representative cohort study that began with a baseline survey in 2011 using a multi-stage sampling method. The survey encompasses 28 provinces, 150 counties, and 450 villages or urban communities across China. Follow-up surveys were conducted in 2013, 2015, and 2018 to comprehensively collect health status and related factors among the elderly population in China. The study received approval from the Biomedical Ethics Review Committee of Peking University (IRB00001052-11015), and all participants provided written informed consent [49].
In this study, we selected participants aged 45 years and older who engaged in less than 600 METs (metabolic equivalents) of physical activity per week, representing a sedentary middleaged and older population. Consequently, our exclusion criteria included participants who were younger than 45 years at baseline (n=2547), lacked baseline cognitive scores (n=4782), or had missing key information (such as education level, marital status, smoking habits, alcohol consumption, self-rated health, participation in leisure activities, and CES-D 10 scores) (n=64291). Additionally, 1636 participants were excluded due to the absence of follow-up cognitive data. Ultimately, 3461 participants had complete study data, with 516 participants providing at least two cognitive scores, which were included in the current analysis (Figure 1).
Assessment of sedentary behavior
In CHARLS database, sedentary behavior was not directly measured. To assess the sedentary behavior of middle-aged and older adults, this study employed the International Physical Activity Questionnaire (IPAQ), along with previous research evaluating leisure activities, to reflect sedentary behavior in this population. This approach aimed to indirectly capture levels of physical activity and leisure participation in order to identify sedentary individuals within the group.
During CHARLS survey periods in 2011, 2013, 2015, and 2018, participants were asked whether they had engaged in at least 10 continuous minutes of physical activity in the past week. These activities were categorized as Vigorous Physical Activity (VPA), such as weightlifting, digging, farming, aerobics, and fast cycling; Moderate Physical Activity (MPA), such as lifting light objects, cycling at a normal pace, and practicing Tai Chi; and Light Physical Activity (LPA), such as walking while working, walking at home, or walking for leisure.
Participants were also asked about the frequency of these activities (from 0 to 7 days per week) and the duration of daily activities (≥10 minutes but <30 minutes, ≥30 minutes but <2 hours, ≥2 hours but <4 hours, or ≥4 hours). Since the questionnaire did not specify durations, we adopted a method from previous studies to convert these time intervals into medians.
The IPAQ short form assigns a MET value of 3.3 for walking, 4.0 for moderate intensity activities, and 8.0 for vigorous intensity activities [40]. The total physical activity level is the sum of these three PA intensity levels. Finally, individuals with a total Physical Activity Volume (PAV) of less than 600 MET minutes/ week were classified as lacking sufficient physical activity, indicating their sedentary status.
Assessment of cognition
Based on previous studies [23,24], cognitive function is divided into two categories: episodic memory and mental intactness. Episodic memory is assessed through a word recall test. The examiner reads a list of 10 randomly selected words, and participants are then asked to recall as many words as possible immediately (immediate recall). The number of correctly recalled words serves as the participant’s immediate recall score. Ten minutes later, participants are asked to recall the same list of words again (delayed recall). The score for episodic memory is the average of the immediate and delayed recall scores, with a range of 0 to 10 points.
Mental integrity is assessed based on certain mental status questions from the Telephone Interview for Cognitive Status (TICS) scale, which evaluates an individual’s cognitive status. In CHARLS, the mental status questions include counting down from 100 by sevens (up to five times), stating the date (month, day, and year), identifying the day of the week, naming the season, and performing a copying test of a star polygon. The responses to these questions are compiled into a mental integrity score, with a range of 0 to 11 points. The overall cognitive score is the sum of the episodic memory score and the mental integrity score, with a total range of 0 to 21 points.
Covariates
In the analysis of this study, we included multiple baseline measurements as covariates, including age, gender, education level, marital status, type of residence, smoking and drinking statue, self-reported health status, chronic diseases, leisure activity scores, and CES-D 10 scores. Education level was categorized as “elementary school and below” and “middle school and above.” Gender was classified as “male” and “female,” while marital status was divided into “married” and “other.” The type of residence was categorized as “rural” and “urban.” Selfreported health status was based on individual subjective feelings, categorized as “good,” “fair,” or “poor.” Sleep duration was divided into “<6 hours/day,” “6-8 hours/day,” and “>8 hours/ day.” Leisure activity scores were calculated based on participants’ engagement in leisure activities, and depression was assessed using the CES-D 10 scale.
Leisure activities are typically defined as voluntary, nonwork-related activities undertaken for enjoyment. Scholars have not reached a consensus on how to measure leisure activities. This study referenced previous research and adopted a six-item scale to assess leisure activities [5]. The six items included: “Interacted with friends”; “Played Ma-jong, played chess, played cards, or went to community club”; “Went to a sport, social, or other kind of club”; “Took part in a community-related organization”; “Done voluntary or charity work”; and “Attended an educational or training course”. In CHARLS, respondents were asked whether they participated in each activity (Yes=1, No=0), and scores for each item were recorded. The total score across all items ranged from 0 to 6, with higher scores indicating a greater level of participation in leisure activities [43].
Smoking status was assessed through two key questions: first, participants were asked, “Have you ever smoked? (including cigarettes, pipes, or chewing tobacco).” Those who denied any smoking history were classified as “never smokers.” For individuals who confirmed a smoking history, a follow-up question was asked: “Are you currently smoking, or have you quit?” Based on their responses, they were classified as “current smokers” or “former smokers.” Similarly, drinking behavior was classified according to current alcohol consumption status, divided into “current drinkers” and “never drinkers.”
Statistical analysis
Statistical analyses were conducted using R version 4.4.1 and SPSS version 27.0. A GBTM was employed to identify potential categories of cognitive function development among sedentary middle-aged and older adults. The GBTM utilizes maximum likelihood estimation to classify individuals with similar symptom trajectories, distinguishing subgroups that exhibit different patterns of cognitive function development.
The primary outcome measure was the Mini-Mental State Examination (MMSE) score, which can be regarded as continuous data approximating a normal distribution. Consequently, a truncated normal model was utilized to fit the trajectories. The modeling process began with a smaller number of subgroups, with each subgroup initially fitted using a high-order polynomial function. If the higher-order terms were found to be statistically insignificant, they were removed, and the model was refitted using lower-order terms.
In assessing model fit, we focused on key information criteria: the Bayesian Information Criterion (BIC), the Akaike Information Criterion (AIC), and the Corrected Akaike Information Criterion (CAIC). Lower values of BIC, AIC, and CAIC indicate better model fit, while an average posterior probability (AvePP) greater than 0.7 suggests acceptable model fit (Nagin). To achieve the study objectives, we carefully evaluated the model fit indices to identify the optimal model, ensuring its accuracy in representing the trajectories of depressive symptoms.
For baseline characteristics, independent sample tests were used to compare continuous variables among different cognitive function trajectory groups, while chi-square tests were employed for categorical variables. To identify potential predictors of cognitive function trajectories and mitigate multicollinearity, a Least Absolute Shrinkage and Selection Operator (LASSO) regression was performed. The best subset of predictive variables was selected using 10-fold cross-validation. Based on the results of the LASSO regression, a multivariable logistic regression model was employed to determine predictors associated with trajectory group membership. All statistical tests in this study were two-tailed, with a p-value of less than 0.05 indicating statistical significance.
Results
Participant characteristics
A total of 3,461 participants were included in the baseline analysis of this study. The average age of the participants was 61.53 years (standard deviation: 10.04 years). Females comprised 51.8% of the sample, with the majority residing in rural areas (56.7%). The education level was generally low, with 64.6% of participants having an education level of elementary school or below. Regarding marital status, 85.6% of participants were married.
In terms of lifestyle habits, the average score for leisure activities among participants was 0.58. When assessing self-rated health status, 30.9% of participants classified their health as poor, while 76.5% reported having chronic illnesses. In relation to smoking and drinking behaviors, 56.6% of participants had never smoked, and 58.3% had never consumed alcohol. Additionally, the average scores on the MMSE and CES-D 10 scales were 11.57 (standard deviation: 3.79) and 8.44 (standard deviation: 6.36), respectively (Table 1).
Cognitive function trajectories
We considered various group numbers (1-5 groups) and functional forms (intercept, linear, quadratic, cubic) to fit the trajectories of depressive symptoms. Although the model with two trajectories demonstrated slightly better fit indices, including lower AIC (21,476.73), BIC (21,533.32), and CAIC (21,542.32), we opted for a three-trajectory model to better capture the heterogeneity of cognitive function development, aligning with the study objectives. While the three-trajectory model did not possess the lowest fit indices (AIC=21,739.65, BIC=21,808.82, CAIC=21,819.82), it provided adequate classification probabilities (all greater than 0.7). This balance between model fit and a more detailed description of cognitive function trajectories led us to adopt the three-trajectory solution (Figure 2).
Based on the MMSE scores, we identified three distinct trajectories of cognitive function scores (Figure 2). The first group, termed the “Low Cognitive Function Group” (n=505, 14.6%), consistently exhibited low MMSE scores, all below 3, indicating relatively poor cognitive function. The second group, referred to as the “Moderate Cognitive Function Group,” demonstrated moderate MMSE scores, which were higher than those of the low cognitive function group (n=783, 22.6%). Finally, the third group, characterized by relatively high MMSE scores consistently above 13, was classified as the “High Cognitive Function Group,” reflecting a higher level of cognitive function within the study and representing the largest subgroup of older adults with superior cognitive abilities (n=2,173, 62.8%).
Logistic regression analysis of factors influencing cognitive function trajectories
We utilized LASSO regression to identify seven variables with the greatest predictive potential: age, gender, education level, marital status, leisure activities, residence, and CES-D 10 scores (see Supplementary Figures 1 and 2 & Table 2). These seven variables were subsequently included as independent variables in a multivariable logistic regression analysis, with depressive symptom trajectory groups as the dependent variable (Figure 3).
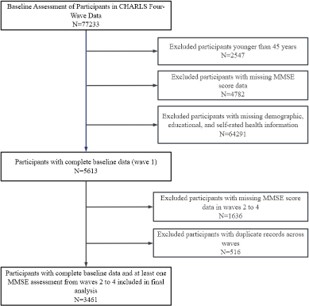
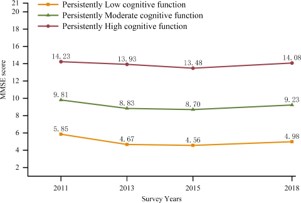
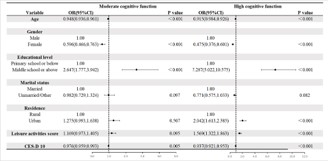
Table 1: Basic characteristics of participants across different survey waves.
| Variable | Total sample (n=3461) | Participant Characteristics across survey waves | P value | |||
|---|---|---|---|---|---|---|
| Wave 1 (n=868) | Wave 2 (n=477) | Wave 3 (n=927) | Wave 4 (n=1189) | |||
| Age, M±SD | 61.53±10.04 | 60.36±9.97 | 59.34±9.86 | 62.56±9.72 | 62.47±10.20 | <0.001* |
| Gender, n(%) | <0.001* | |||||
| Male | 1668(48.2) | 379(43.7) | 169(35.4) | 474(51.1) | 646(54.3) | |
| Female | 1793(51.8) | 489(56.3) | 308(64.6) | 453(48.9) | 543(45.7) | |
| Residence, n(%) | <0.001* | |||||
| Urban | 1490(43.1) | 432(49.8) | 189(39.6) | 362(39.1) | 507(42.6) | |
| Rural | 1971(56.7) | 436(50.2) | 288(60.4) | 565(60.9) | 682(57.4) | |
| Educational level, n(%) | 0.020* | |||||
| Primary school or below | 2235(64.6) | 536(61.8) | 314(65.8) | 633(68.3) | 752(63.2) | |
| Middle school or above | 1226(35.4) | 332(38.2) | 163(34.2) | 294(31.7) | 437(36.8) | |
| Marital status, n(%) | 0.869 | |||||
| Married | 2961(85.6) | 739(85.1) | 411(86.2) | 788(85.0) | 1023(86.0) | |
| Other | 500(14.4) | 129(14.9) | 66(13.8) | 139(15.0) | 166(14.0) | |
| Self-reported health, n(%) | 0.064 | |||||
| Poor | 1070(30.9) | 274(31.6) | 143(30.0) | 276(29.8) | 377(31.7) | |
| Fair | 1623(46.9) | 397(45.7) | 223(46.8) | 474(51.1) | 529(44.5) | |
| Good | 768(22.2) | 197(22.7) | 111(23.3) | 177(19.1) | 283(23.8) | |
| Chronic diseases, n(%) | <0.001* | |||||
| Yes | 2646(76.5) | 618(71.2) | 339(71.1) | 754(81.3) | 935(78.6) | |
| No | 815(23.5) | 250(28.8) | 138(28.9) | 173(18.7) | 254(21.4) | |
| Smoking status, n(%) | <0.001* | |||||
| Current smokers | 978(28.3) | 231(26.6) | 86(18.0) | 280(30.2) | 381(32.0) | |
| Former smokers | 523(15.1) | 89(10.3) | 42(8.8) | 174(18.8) | 218(18.3) | |
| Never smokers | 1960(56.6) | 548(63.1) | 349(73.2) | 473(51.0) | 590(49.6) | |
| Drinking status, n(%) | <0.001* | |||||
| Current drinkers | 1442(41.7) | 312(35.9) | 148(31.0) | 416(44.9) | 566(47.6) | |
| Never drinkers | 2019(58.3) | 556(64.1) | 329(69.0) | 511(55.1) | 623(52.4) | |
| Sleep time, n(%) | 0.011* | |||||
| <6h/d | 1140(32.9) | 250(28.8) | 163(34.2) | 318(34.3) | 409(34.4) | |
| 6-8h/d | 2027(58.6) | 550(63.4) | 274(57.4) | 513(55.3) | 690(58.0) | |
| >8h/d | 294(8.5) | 68(7.8) | 40(8.4) | 96(10.4) | 90(7.6) | |
| Leisure activities score, M±SD | 0.58±0.77 | 0.55±0.74 | 0.69±0.84 | 0.57±0.78 | 0.55±0.74 | 0.017* |
| MMSE score, M±SD | 11.57±3.79 | 11.68±3.71 | 11.76±3.78 | 10.86±3.86 | 11.96±3.73 | <0.001* |
| CES-D score, M±SD | 8.44±6.36 | 8.47±6.32 | 7.91±5.77 | 8.56±6.52 | 8.56±6.48 | 0.595 |
Abbreviations: n: Number; SD: Standard Deviation; *p<0.05
Using the “Low Cognitive Function Group” as the reference category, the multivariable logistic regression analysis revealed significant demographic differences among the subgroups. The results indicated that older adults may experience a continuous decline in cognitive function with advancing age. Women exhibited lower cognitive function levels across all groups, particularly pronounced in the High Cognitive Function Group. Additionally, higher education levels (junior high school and above) were identified as a protective factor for cognitive function. Unmarried individuals demonstrated lower cognitive function levels, with the most significant impact observed in the High Cognitive Function Group, suggesting a higher risk of cognitive impairment. Furthermore, individuals residing in urban areas showed higher cognitive function levels compared to those in rural areas. Engaging in more leisure activities significantly enhanced cognitive function levels. Lastly, older adults with lower CES-D 10 scores, indicating no or mild depressive symptoms, also exhibited relatively higher cognitive function levels, particularly in the High Cognitive Function Group. These findings underscore the critical roles of demographic, lifestyle, and health-related factors in depressive symptom trajectories and provide valuable insights for developing targeted interventions and public health strategies aimed at improving cognitive function within this population.
Discussion
Recent studies have increasingly highlighted the potential adverse effects of sedentary behavior on cognitive function [13]. Prolonged periods of sitting can affect various physiological functions, which may in turn impact cognitive abilities. Additionally, sedentary behavior may be associated with increased chronic inflammation, where the accumulation of inflammatory factors can influence neural plasticity and neurotransmission through multiple pathways, thereby impairing cognitive function [22].
Although numerous studies have explored the relationship between sedentary behavior and cognitive function, there remains some controversy and uncertainty regarding the specific mechanisms and causal relationships involved. Furthermore, most research on cognitive function primarily focuses on older adults, with studies targeting sedentary older populations largely relying on cross-sectional data [2,7]. Differences in study findings often arise from variations in sample characteristics, measurement methods for sedentary behavior, research designs, and the specific domains of cognitive function examined [39]. Thus, further investigation into the complex relationship between sedentary behavior and cognitive function is crucial for revealing potential factors influencing cognitive changes and for developing effective prevention and intervention strategies. This study utilized data from CHARLS from 2011 to 2018 to explore the cognitive function trajectories and risk factors in sedentary middle-aged and elderly adults in China.
We identified three distinct trajectories of cognitive function, named “Low Cognitive Function Group,” “Moderate Cognitive Function Group,” and “High Cognitive Function Group.” In our study, 14.6% of sedentary middle-aged and elderly adults were classified as the “Low Cognitive Function Group,” consistently scoring low on the MMSE, with scores remaining within a low range. The “Moderate Cognitive Function Group” comprised 22.6% of participants, whose MMSE scores were consistently higher than those in the low cognitive function group, maintaining an average around 9 points. Finally, 62.8% of the population fell into the “High Cognitive Function Group,” displaying consistently high and stable MMSE scores throughout the observation period, representing the highest cognitive function levels among middle-aged and elderly adults.
Research indicates that initial cognitive function levels and the maintenance or decline of cognitive function over time are important predictors of cognitive impairment development [34]. Therefore, prioritizing the prevention and intervention of cognitive dysfunction in the “High Cognitive Function Group” is essential, employing early screening and targeted measures to improve cognitive outcomes. Our findings reveal heterogeneity in cognitive function trajectories among sedentary middleaged and elderly adults in China, underscoring the importance of developing strategies and interventions tailored to different cognitive trajectories to enhance cognitive health in this population [14].
This study thoroughly examined various factors influencing cognitive function trajectories among sedentary middle-aged and elderly adults. The results from the multivariable logistic regression analysis clearly indicated that factors such as age, gender, education level, leisure activities, residence, and CES-D 10 scores significantly influenced the classification of cognitive function trajectories (P<0.05).
From a demographic perspective, being male, married, and having a higher education level were protective factors against cognitive decline. Physiologically, the decline in metabolic rate and cardiovascular function with increasing age may make middle-aged and elderly adults more susceptible to the adverse effects of sedentary behavior [1]. Multiple studies have shown that prolonged sedentary behavior is significantly associated with cognitive decline in older populations [35]. Furthermore, gender also exhibits unique characteristics in the relationship between sedentary behavior and cognitive function. Some studies have found that women may have relative advantages in certain cognitive domains, such as verbal memory and emotional processing, yet they may also be more adversely affected by sedentary behavior [8]. This aligns with our study results, indicating that women performed worse than men in terms of cognitive function.
Marital status significantly impacts individual lifestyle and mental health, potentially linking sedentary behavior and cognitive function [15]. Emotional support and companionship within marriage may positively influence mental health, which is crucial for maintaining cognitive function [29]. Conversely, unmarried individuals may experience greater lifestyle freedom but could also face increased feelings of loneliness and poor habits, adversely affecting cognitive function [21].
Education level serves as a key indicator of individual knowledge, cognitive ability development, and lifestyle differences [12]. Generally, individuals with junior high school education or higher tend to engage in occupations that require higher cognitive involvement and have greater access to diverse information and learning resources, which can help maintain and enhance cognitive function [48]. Studies have shown that individuals with lower education levels may be more susceptible to negative lifestyle influences, including sedentary behavior [27].
Differences in residence can lead to various disparities in living environments, lifestyles, and health resources, impacting the relationship between sedentary behavior and cognitive function [41]. Residents in rural areas often have limited access to medical and health promotion resources, leading to fewer opportunities for cognitive health enhancement, making them more vulnerable to cognitive risks associated with sedentary behavior [38].
Moreover, the type and frequency of leisure activities significantly influence individual sedentary behavior patterns and the development and maintenance of cognitive function [31]. Engaging in active leisure activities helps reduce sedentary time, promotes brain blood circulation, and enhances neural plasticity, thus positively impacting cognitive function [4]. A study focusing on different leisure activity patterns found that individuals predominantly engaged in sedentary activities performed worse on cognitive tests compared to those who regularly participated in diverse and active leisure activities [37]. The interplay between depression, sedentary behavior, and cognitive function is complex. On one hand, depression may lead to a lack of motivation and interest in physical activity, thereby increasing sedentary time [26]. On the other hand, prolonged sedentary behavior may exacerbate depressive symptoms, negatively impacting cognitive function [44]. Research has shown that individuals with higher CES-D 10 scores, indicating more pronounced depressive symptoms, often exhibit poorer performance across various cognitive domains, such as attention, memory, and executive function [16].
In summary, factors such as age, gender, education level, residence, leisure activities, marital status, and depressive symptoms may all play significant roles in the relationship between sedentary behavior and cognitive function. However, the specific mechanisms of interaction among these factors and their differential impacts across various populations remain largely unknown. Further investigation into these factors is crucial for comprehensively understanding the complex relationship between sedentary behavior and cognitive function, as well as for developing targeted interventions and health promotion strategies.
The identified differences in characteristics between various cognitive function trajectory groups in this study highlight the need for personalized prevention and control measures tailored to individuals with distinct trajectory profiles. Based on the identified group characteristics, priority should be given to the prevention and treatment of cognitive impairment among sedentary middle-aged and elderly adults women with low education levels (elementary school or below), those who are unmarried, and those residing in rural areas. Additionally, individuals who do not participate in leisure activities or who have higher risks of depressive symptoms should also be prioritized in intervention efforts.
The primary strength of this study lies in enhancing our understanding of the relationship between sedentary behavior and cognitive function trajectories among middle-aged and elderly adults, particularly within the Chinese social and cultural context. By employing GBTM, this research explored the diversity of cognitive function trajectories, allowing for classification using cognitive assessments across four waves. The characteristics and trends of different trajectory subgroups can inform detailed intervention and support strategies to improve the mental health of sedentary middle-aged and elderly adults. Furthermore, this study, based on a large sample of middle-aged and older adults in China, provides a high degree of generalizability to the population.
However, this study has several limitations. First, the assessment of cognitive function relied on self-reported measures, which may introduce information bias. Second, the exclusion of participants lacking baseline demographic data and MMSE scores may lead to selection bias. Third, our study primarily focused on outcomes following cognitive function changes, without examining prior factors, such as the relationship between sedentary behavior and cognitive function, which requires further investigation. Fourth, the study did not fully utilize panel data, which may result in endogeneity issues due to time-invariant variables. Finally, the sample was limited to participants from China, and thus the generalizability of the findings to other countries or populations remains uncertain.
Conclusion
There is significant heterogeneity in the trajectories of cognitive symptoms among sedentary middle-aged and elderly adults in China. Recognizing the characteristics of these different subgroups is crucial, as it aids in predicting various risk factors and more accurately identifying high-risk populations that require targeted monitoring and intervention, ultimately leading to more effective care.
Declarations
Author contributions: Ran Yan collected the cohort data, ensuring data integrity. Siyuan Kong conducted the statistical analysis. Siyuan Kong was the primary contributor to the manuscript. All authors have reviewed and approved the final manuscript, agreeing to be accountable for all aspects of the work.
Conflict of interest statement: There are no conflicts of interest to declare regarding the submission of this manuscript, and the manuscript has been approved by all authors for publication.
Ethical statement: This study does not involve data collected from human subjects. We utilized only publicly available deidentified samples. The present article conducts a data analysis of survey data that have been ethically approved and are in the public domain.
Acknowledgments: We express our gratitude to the China Health and Retirement Longitudinal Study (CHARLS) team for providing the data. Publicly available datasets were analyzed in this study. These data can be found at http://charls.pku.edu. cn/. And the research reported in the manuscript has been previously approved and registered by Peking University.
References
- Anker SD, Usman MS, Butler J. SGLT2 inhibitors: from antihyperglycemic agents to all-around heart failure therapy. Circulation. 2022; 146: 299–302.
- Annaka H, Nomura T, Moriyama H. Sedentary time and cognitive impairment in patients using long-term oxygen therapy: a crosssectional study. Int J Environ Res Public Health. 2022; 19.
- Bako AT, Potter T, Tannous J, Pan AP, Johnson C, Baig E, et al. Sex differences in post-stroke cognitive decline: a population-based longitudinal study. PLoS One. 2022; 17: e0268249.
- Bobovnik G, Music T, Kutin J. Liquid level detection in standard capacity measures with machine vision. Sensors. 2021; 21.
- Bone JK, Bu F, Fluharty ME, Paul E, Sonke JK, Fancourt D. Engagement in leisure activities and depression in older adults in the United States: longitudinal evidence from the Health and Retirement Study. Soc Sci Med. 2022; 294: 114703.
- Chen RH, Jiang XZ, Zhao XH, Qin YL, Gu Z, Gu PL, et al. Risk factors of mild cognitive impairment in middle-aged patients with type 2 diabetes: a cross-sectional study. Ann Endocrinol. 2012; 73: 208–212.
- Chen S, Chen T, Honda T, Nofuji Y, Kishimoto H, Narazaki K. Associations of objectively measured sedentary time and patterns with cognitive function in non-demented Japanese older adults. Int J Environ Res Public Health. 2022; 19.
- Coronel L, Riege K, Schwab K, Forste S, Hackes D, Semerau L, et al. Transcription factor RFX7 governs a tumor suppressor network in response to p53 and stress. Nucleic Acids Res. 2021; 49: 7437–7456.
- de Rezende LFM, Rodrigues LM, Rey-Lopez JP, Matsudo VK, Luiz OC. Sedentary behavior and health outcomes: an overview of systematic reviews. PLoS One. 2014; 9: e105620.
- Falck RS, Davis JC, Liu-Ambrose T. What is the association between sedentary behaviour and cognitive function? A systematic review. Br J Sports Med. 2017; 51: 800–811.
- Falck RS, Landry GJ, Best JR, Davis JC, Chiu BK, Liu-Ambrose T. Cross-sectional relationships of physical activity and sedentary behavior with cognitive function in older adults with probable mild cognitive impairment. Phys Ther Rehabil J. 2017; 97: 975– 984.
- Feng Z, Zang C, Zhang L, Yin S, Zhuang Q, Wang X. STING activation promotes inflammatory response and delays skin wound healing in diabetic mice. Biochem Biophys Res Commun. 2022; 611: 126–131.
- Feyaerts J, Henriksen MG, Vanheule S, Myin-Germeys I, Sass LA. Delusions beyond beliefs: a critical overview of diagnostic, aetiological and therapeutic schizophrenia research. Lancet Psychiatry. 2021; 8: 237–249.
- Gennuso KP, Gangnon RE, Matthews CE, Thraen-Borowski KM, Colbert LH. Sedentary behavior, physical activity and markers of health in older adults. Med Sci Sports Exerc. 2013; 45: 1493– 1500.
- Ghaziof S, Shojaei S, Mehdikhani M, Khodaei M, Jafari NM. Electro-conductive 3D-printed polycaprolactone/gold nanoparticle scaffolds for myocardial tissue engineering. J Mech Behav Biomed Mater. 2022; 132: 105271.
- Gurewitz O, Shifrin M, Dvir E. Data gathering techniques in wireless sensor networks: a cross-layer view. Sensors. 2022; 22.
- Hannan M, Collins EG, Phillips SA, Quinn L, Steffen A, Bronas UG. Influence of sedentary behavior on the relationship between cognitive and vascular function in older adults with and without chronic kidney disease. Nephrol Nurs J. 2021; 48: 553–561.
- Hoang TD, Reis J, Zhu N, Jacobs DJ, Launer LJ, Whitmer RA, et al. Effect of early adult physical activity and television viewing on midlife cognitive function. JAMA Psychiatry. 2016; 73: 73–79.
- Ijaz N, Jamil Y, Brown CT, Krishnaswami A, Orkaby A, Stimmel MB, et al. Role of cognitive frailty in older adults with cardiovascular disease. J Am Heart Assoc. 2024; 13: e033594.
- Jongsiriyanyong S, Limpawattana P. Mild cognitive impairment in clinical practice. Am J Alzheimers Dis Other Demen. 2018; 33: 500–507.
- Lee MY, Tanenbaum ML, Maahs DM, Prahalad P. Overcoming barriers to diabetes technology in youth with type 1 diabetes and public insurance. Case Rep Endocrinol. 2022; 2022: 9911736.
- Lehrer S, Rheinstein PH. Ivermectin Docks to the SARS-CoV-2 Spike Receptor-binding Domain Attached to ACE2. In Vivo. 2020; 34: 3023-3026.
- Lei X, Hu Y, McArdle JJ, Smith JP, Zhao Y. Gender differences in cognition among older adults in China. J Hum Resour. 2012; 47: 951–971.
- Lei X, Smith JP, Sun X, Zhao Y. Gender differences in cognition in China and reasons for change over time. J Econ Ageing. 2014; 4: 46–55.
- Leicht H, Heinrich S, Heider D, Bachmann C, Bickel H, van den Bussche H, et al. Net costs of dementia by disease stage. Acta Psychiatr Scand. 2011; 124: 384–395.
- Liu W, Yu D, Yuan S, Yi J, Cao Y, et al. Effects of spatial fragmentation on the elevational distribution of bird diversity in a mountain adjacent to urban areas [Journal Article]. Ecology and Evolution. 2022; 12: e9051.
- Mahalaxmi G, Ashok S, Arun G, Srinivas G. Albumin binds to uncoupler CCCP to diminish depolarization of mitochondria [Journal Article]. Toxicology in Vitro. 2022; 80: 105325.
- Marinac CR, Nelson SH, Cadmus-Bertram L, Kerr J, Natarajan L, Godbole S, et al. Dimensions of sedentary behavior and cognitive functioning in breast cancer survivors. Support Care Cancer. 2019; 27: 1435–1441.
- Minahk C. In through the Out Exit: the Role of the Exocyst in Listeria monocytogenes Cell Entry. Infection and Immunity. 2022; 90: e48422.
- Nagin DS, Odgers CL. Group-based trajectory modeling in clinical research Research Support, N.I.H., Extramural; Research Support, U.S. Gov’t, Non-P.H.S. Annual Review of Clinical Psychology. 2010; 6: 109-138.
- Nelson T, Engberg A, Smalheer M, Murphy B, Csank J, RowlandSeymour A, et al. Integrating First Responder Hands-on Training into Medical School Curricula-a Perspective from Medical Students. Medical Science Educator. 2020; 30: 1729-1730.
- Prince M, Ali GC, Guerchet M, Prina AM, Albanese E, Wu YT. Recent global trends in the prevalence and incidence of dementia and survival. Alzheimers Res Ther. 2016; 8: 23.
- Pu L, Pan D, Wang H, He X, Zhang X, Yu Z, et al. A predictive model for the risk of cognitive impairment in community middle-aged and older adults. Asian Journal of Psychiatry. 2023; 79: 103380.
- Raichlen DA, Klimentidis YC, Sayre MK, Bharadwaj PK, Lai M, Wilcox RR, et al. Leisure-time sedentary behaviors and risk of dementia. Proc Natl Acad Sci U S A. 2022; 119: e2088036177.
- Raymundo-Martinez G, Alanis-Estrada GP, Araiza-Garaygordobil D, Delgado-Cruz IV, Gopar-Nieto R, Cabello-Lopez A, et al. Gender differences in cardiology professionals: a Latin American survey. Arch Cardiol Mex. 2022; 92: 11–18.
- Roberts AL, Liu J, Lawn RB, Jha SC, Sumner JA, Kang JH, et al. Association of posttraumatic stress disorder with accelerated cognitive decline in middle-aged women. JAMA Netw Open. 2022; 5: e2217698.
- Rutkowski N, MacDonald-Liska C, Baines KA, Samuel V, Harris C, Lebel S. Can Oncol Nurs J. 2021; 31: 457–462.
- Setiawan RC, Wu M, Li DY. Dependence of interfacial adhesion between substances on their electron work functions. Langmuir. 2022; 38: 1672–1679.
- Stern E, Shterzer N, Mills E. Characterizing 5-oxoproline sensing pathways of Salmonella enterica serovar Typhimurium. Sci Rep. 2022; 12: 15975.
- Tian Y, Shi Z. Effects of physical activity on daily physical function in Chinese middle-aged and older adults: a longitudinal study from CHARLS. J Clin Med. 2022; 11.
- Tran TB, Wong P, Raoof M, Melstrom K, Fong Y, Melstrom LG. The evolving gender distribution in authorship over time in American surgery. Am J Surg. 2022; 224: 1217–1221.
- Tremblay MS, Aubert S, Barnes JD, Saunders TJ, Carson V, Latimer-Cheung AE, et al. Sedentary Behavior Research Network terminology consensus project. Int J Behav Nutr Phys Act. 2017; 14: 75.
- Wang J. Longitudinal relationship between leisure activities and depressive symptoms among older Chinese adults. BMC ublic Health. 2024; 24: 763.
- Waring JD, Williams SE, Stevens A, Pogarcic A, Shimony JS, Snyder AZ, et al. Combined cognitive training and vortioxetine mitigates age-related declines in functional brain network integrity. Am J Geriatr Psychiatry. 2023; 31: 385–397.
- Xue M, Jia X, Shi X, Yang C, Wang R, Zhao C, et al. Association between sarcopenia and cognitive trajectories among middleaged and older adults in China. J Nutr Health Aging. 2023; 27: 243–250.
- Yan S, Fu W, Wang C, Mao J, Liu B, Zou L, Lv C. Association between sedentary behavior and the risk of dementia: a systematic review and meta-analysis. Transl Psychiatry. 2020; 10: 112.
- Yuan Y, Peng C, Burr JA, Lapane KL. Frailty, cognitive impairment and depressive symptoms in Chinese older adults: an eight-year multi-trajectory analysis. BMC Geriatr. 2023; 23: 843.
- Zhang Z, Li Y, Xiang Z, Huang Y, Wang R, Chang C. Dielectric dispersion characteristics of the phospholipid bilayer with subnanometer resolution from terahertz to mid-infrared. Front Bioeng Biotechnol. 2022; 10: 984880.
- Zhao Y, Hu Y, Smith JP, Strauss J, Yang G. Cohort profile: the China Health and Retirement Longitudinal Study. Int J Epidemiol. 2014; 43: 61–68.
- Zhao Y, Li Y, Wang L, Song Z, Di T, Dong X, et al. Physical activity and cognition in sedentary older adults: a systematic review and meta-analysis. J Alzheimers Dis. 2022; 87: 957–968.